Article • 5 min read
The power of lead value in sales forecasting
Por Josh Bean, Director, Marketing
Última actualización el March 24, 2022
One in four sales managers report being unhappy with their forecast accuracy, according to CSO Insights. However, it’s not always clear what your options are when you’re looking for a better alternative.
For starters, most sales forecasting methods tend to follow one of two general approaches. The first is based on analyzing past revenue results and using that historical data to project future earnings, as in the case of a run rate or exponential smoothing formula. The second, more granular method involves looking closely at the current state of your sales pipeline and predicting how everything will most likely pan out.
Among the latter, more micro-targeted sales forecasting procedures, the lead value technique stands out as one that is both simple and effective.
Read on to learn how to determine lead value, and how this metric can be used to build sales forecasts that result in a more accurate impression of your future revenue.
What is lead value and how is it calculated?
Lead value is a way of measuring how much a lead is worth based on the potential revenue it represents and the probability that it will convert to a sale.
You’ll need to determine both the sales value and conversion rate of a given lead to calculate lead value.
Sales value refers to the amount of money you stand to make from a sale. It usually changes based on the type of lead. For example, a SaaS company’s CRM data may show that leads who request a demo of their product close at $2,000, while leads who come from paid advertising close at half of that amount.
Lead-to-sale conversion rate refers to the percentage of leads that work their way through the sales funnel and become customers. Similar to sales value, this metric will vary depending on the type of lead you’re looking at. For example, that same SaaS company may find that leads who request a demo have a 30% conversion rate, while only 10% of paid advertising leads become customers.
Once you know both the sales value and conversion rate of a particular type of lead, you simply multiply those numbers to calculate the lead value.

Using the same data from our previous examples, we can calculate that leads who request a demo have an average lead value of $600 per lead, or $2,000 multiplied by 0.3. The same company’s paid advertising leads, meanwhile, have a lead value of just $100 per lead, or 10% of $1,000.
How to use lead value to forecast future revenue
You can use the value assigned to each of your leads to predict revenue results for your current pipeline and determine adjustments needed to meet your sales goals. Just add the lead value for every lead in your pipeline together.
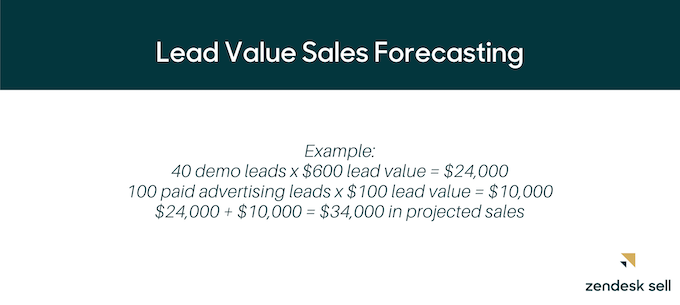
For example, a SaaS company could have 40 demo request leads valued at $600 each and 100 paid advertising leads valued at $100 each. If that’s the total amount of active leads in its pipeline, the company could forecast sales of $34,000.

With this projected revenue and your lead value figures, you can also calculate how many leads are needed to meet your sales revenue goal.
For instance, if that company that is forecasting $34,000 in revenue had set a sales goal of $40,000, it could use average lead value to calculate how many additional leads will likely be needed to hit its original target. In this case, covering the $6,000 difference between sales forecast and sales goal would require 10 more demo leads, 60 more paid advertising leads, or some combination of the two.
Once the company identifies this gap, it can brainstorm lead-magnet strategies to boost sales.
But there are two big factors that sales forecasts based on lead value fail to take into account:
Conversion rate fluctuations
If forecasting with lead value figures, it’s imperative to remember that conversion rates aren’t constant. For example, improvements to your sales process could result in more conversions. When the lead-to-sale conversion rate you’re using in your calculations doesn’t reflect this shift, you risk undervaluing your leads and consequently making decisions based on inaccurate forecasts. Pricing changes and new discount offers are also likely to affect conversion rates, in addition to increasing or decreasing the sales value.
Continually adjusting for such fluctuations requires tracking the moving average of lead value for each lead type over a set period of time, such as the last 45 or 90 days.
Improve your sales process
A good sales process is the foundation of any successful sales organization. Learn how to improve your sales process and close more deals.
Lead sales velocity
It’s equally as important to consider sales velocity with the lead value sales forecasting method.
Leads make their way through the sales cycle at different speeds. For example, a company may discover that leads who request a demo tend to commit to buying the product shortly after their trial period ends. Contrastly, paid advertising leads may take more than a month to fully transition from the awareness to purchasing stages.
Knowing the average sales velocity of each lead source and factoring that into the sales forecast is an essential component of any revenue projection.
How to use Zendesk Sell to bolster your sales forecasting
Sell combines the sales value, conversion rate, and expected sales cycle length to automatically calculate and populate sales forecasts, resulting in faster and more accurate projections than your standard manual lead value method.
As a deal moves through the pipeline stage, Sell automatically adjusts its “Win Likelihood,” or conversion rate. These changes to the conversion rate are then immediately reflected in updated forecasts.

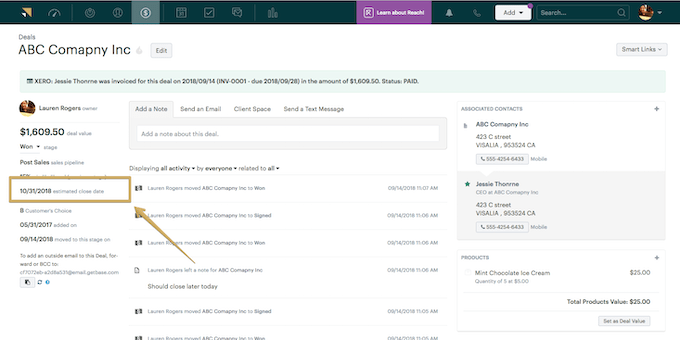
Sell’s forecasting feature also incorporates the sales cycle into its calculations by including an “Estimated Close Date,” a specific date you enter based on the average length of time it typically takes to close a certain type of sale, for each deal. With this feature, you can create more accurate sales forecasts for specific time periods.

Sell calculates its sales forecasts by multiplying the sales value by the “Win Likelihood” set for each deal, with the “Estimated Close Date” determining which potential sales are included in the forecast for a set time period. By adding and controlling for lead sales velocity factor, Sell forecasts have an edge on projections that rely only on lead value.
Close the gap between sales goals and expectations
According to CSO Insights, less than half of all forecasted deals end up closing, indicating a sizeable gap between projection and reality.
You can improve your own sales forecasting by incorporating lead values into your predictions. This method involves a close analysis of your sales pipeline, but still grounds revenue estimates in historical data—your leads’ average sales value and conversion rate—to create highly accurate and informed forecasts.
